What factors determine packaging machinery ROI is not answered by purchase price alone. The real calculation begins on the production floor, beside the changeover cart and the rejected-case bin. It includes output, uptime, labor savings, energy use, maintenance, scrap, integration costs, and resale value. A machine running 20 hours daily may outperform a cheaper model that frequently stops.
Industry data supports this broader view. PMMI’s 2024 State of the Industry report highlights automation, labor shortages, flexible packaging formats, and operational efficiency as important investment drivers. The International Federation of Robotics reported 541,302 industrial robots installed worldwide in 2023. That figure shows how manufacturers are treating automation as a productivity tool, not merely a technology upgrade. However, robotics alone cannot guarantee returns.
Jorge Izquierdo, PMMI’s vice president of market development, has stated, “Packaging machinery investments must support flexibility, efficiency, and the changing needs of manufacturers.” His observation is practical. A fast filler can still deliver poor ROI when formats change every hour, operators need special training, or spare parts arrive slowly. The useful question is not simply, “How much does this machine cost?” Ask how many saleable units it creates, and how consistently.
The spreadsheet may look precise. It rarely is.
A credible assessment should compare several operating scenarios, including lower utilization, planned downtime, financing costs, and unexpected maintenance. This article examines those variables, using supplier data, plant experience, and recognized industry research. Results will differ by product, market, shift pattern, and management discipline. That uncertainty deserves attention. Ignoring it can make an attractive payback period dangerously optimistic.
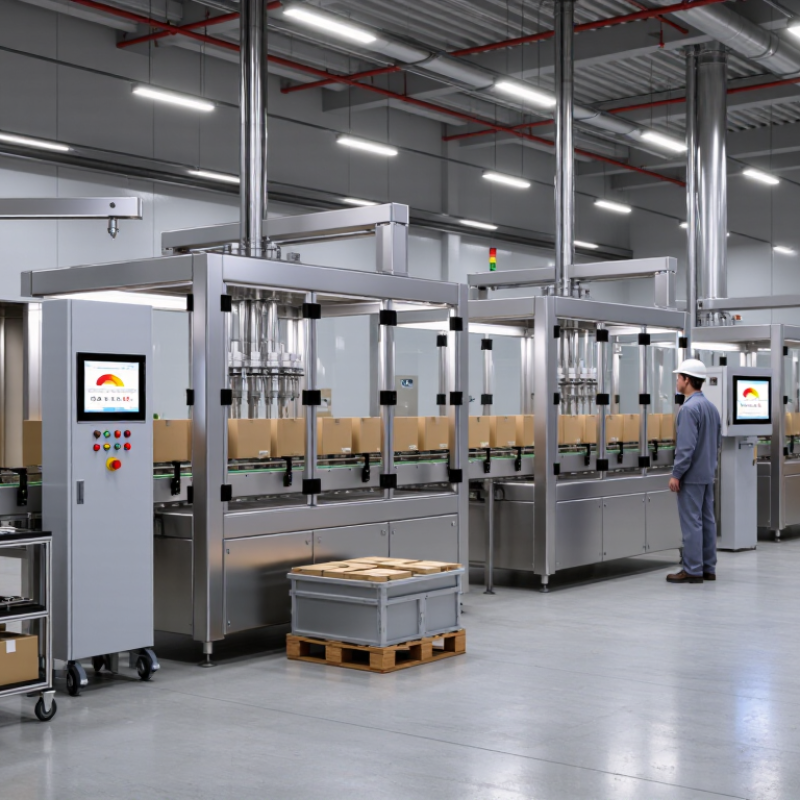
China packaging machinery ROI means the financial return generated by equipment after installation. It is not simply the purchase price divided by annual sales. A practical calculation includes machinery, shipping, integration, commissioning, training, maintenance, energy, and financing costs.
ROI can be measured through labor savings, higher throughput, lower scrap, fewer stoppages, and additional sellable output. PMMI reported approximately US$10.2 billion in U.S. packaging machinery shipments during 2023, up 5.8% year on year. This signals strong automation demand, but demand alone does not prove profitability. The International Federation of Robotics reported 276,288 industrial robots installed in China during 2023, representing 51% of global installations. These figures show scale, not guaranteed returns. A neat spreadsheet can still mislead.
Tips: Record production data for at least three months before installation. Track units per hour, changeover minutes, rejection rates, labor hours, and unplanned downtime. Use this baseline to calculate payback, then test a 36-month ROI scenario in yuan. Include spare parts and operator training. Measure both. A machine may raise output while increasing energy use or maintenance complexity. That weakness deserves honest review.
| ROI Dimension | How It Is Measured | Typical Planning Range | Illustrative Mid-Scale Line | Impact on ROI |
|---|---|---|---|---|
| Initial capital investment | Purchase price plus tooling, installation, commissioning, training, and integration | US$80,000–US$450,000 per automated line | US$220,000 total installed cost | A lower installed cost improves payback, provided quality and uptime are maintained |
| Usable production capacity | Rated speed × operating hours × actual utilization | 4,000–12,000 operating hours per year | 6,000 hours per year at 75% utilization | Higher utilization spreads fixed investment across more saleable units |
| Overall equipment effectiveness (OEE) | Availability × performance × quality rate | 60%–85%, depending on product and operating conditions | 72% baseline; 80% target after stabilization | Improved OEE increases output without proportional capital expenditure |
| Labor-cost savings | Reduced operators, overtime, rework labor, and manual inspection hours | US$30,000–US$180,000 annual gross savings | US$78,000 annual gross savings | Usually one of the largest recurring benefits of automation |
| Material waste reduction | Material saved through better filling, sealing, cutting, coding, and inspection accuracy | 0.5–3.0 percentage-point reduction in waste | 1.5 percentage-point reduction; US$42,000 annual saving | The benefit rises with expensive films, ingredients, components, or printed materials |
| Quality and rework costs | Rejected units, customer returns, re-inspection, disposal, and corrective labor | 0.5%–3.0% of production value | US$24,000 annual reduction in quality-related costs | Consistent sealing, dosing, labeling, and vision inspection protect realized revenue |
| Energy consumption | Electricity, compressed air, heating, cooling, and gas consumed per saleable unit | 5%–20% improvement after equipment replacement or optimization | US$9,000 annual energy saving | Important where lines run continuously or energy-intensive sealing and heating are used |
| Maintenance and spare parts | Preventive maintenance, consumables, replacement parts, technician visits, and downtime | 2%–6% of equipment cost per year | US$10,000 annual net maintenance cost | Reliable local support and accessible parts can materially reduce total ownership cost |
| Downtime cost | Unplanned downtime hours × contribution margin per production hour | US$100–US$2,000 per lost production hour | US$18,000 annual avoided downtime loss | Small reliability improvements can produce significant returns on high-volume lines |
| Annual operating benefit | Labor savings + material savings + quality savings + energy savings + avoided downtime − additional operating costs | Calculated from site-specific production and cost data | US$161,000 per year | This is the primary cash-flow input for payback and ROI calculations |
| Simple payback period | Total installed investment ÷ annual operating benefit | Approximately 1.5–4.0 years for many automation projects | US$220,000 ÷ US$161,000 = 1.37 years | A shorter payback generally indicates lower investment risk, but it excludes financing and tax effects |
| First-year simple ROI | (Annual operating benefit − annualized investment cost) ÷ investment cost × 100% | Varies widely with utilization, labor rates, and product margin | (US$161,000 − US$220,000) ÷ US$220,000 = −26.8% in Year 1 if full investment is charged immediately | ROI should be reported with the selected accounting period to avoid misleading comparisons |
| Three-year cumulative ROI | (Three-year benefits − investment − three-year additional costs) ÷ investment × 100% | Sensitive to ramp-up time, maintenance, financing, and demand stability | (US$483,000 − US$220,000) ÷ US$220,000 = 119.5% | A multi-year view better reflects the economic life of packaging machinery |
| Economic service life | Years of productive operation before replacement, major refurbishment, or technology obsolescence | 8–15 years with appropriate maintenance and upgrades | 10-year evaluation period | Longer useful life increases lifetime ROI, especially after payback is achieved |
| Residual or resale value | Expected value of the equipment at the end of the evaluation period | Often modeled at 5%–20% of original equipment cost | US$22,000 at the end of Year 10 | Including residual value improves the accuracy of discounted cash-flow analysis |
Include the machine price, shipping, customs handling, installation, commissioning, and operator training. Factory changes may add wiring, air lines, flooring, or safety guards. Small costs accumulate.
Measure electricity, compressed air, film, labels, lubricants, and replacement parts per finished unit. Include maintenance contracts, calibration, software support, and spare-part inventory. Do not ignore downtime.
Compare current wages, overtime, turnover, training, and staffing requirements with the automated process. A machine may need fewer operators but still require a skilled technician. Savings are not automatic.
Downtime reduces output and may create urgent repair expenses. Track unplanned stops, repair time, and lost production hours every month. One quiet shift can hide a serious loss.
Consistent sealing, filling, coding, and case packing can reduce damaged cartons and rejected shipments. Track complaints, rework hours, first-pass yield, and material waste before installation. Quality gains are harder to price.
No. Short orders, cleaning, material variation, changeovers, and training delays reduce actual production time. Use real throughput from similar equipment in your facility. Speed can mislead.
Compare annual savings with total annualized costs, rather than comparing savings with the purchase price alone. Include financing interest, currency movement, utilities, labor, maintenance, waste, and downtime. Leave room for uncertainty.
Review utility use, waste, labor hours, maintenance spending, and output monthly after commissioning. Compare actual results with the original assumptions. Our first estimate was too optimistic.
What factors determine packaging machinery roi depends on how effectively a machine converts investment into measurable business value. ROI is usually assessed by comparing the initial purchase price and installation costs with long-term gains from higher output, reduced labor, lower material waste, improved energy efficiency, and fewer production interruptions. Machine speed, accuracy, reliability, and compatibility with existing processes directly influence packaging capacity, operating costs, and profit margins.
Automation can reduce repetitive manual work while improving consistency and product quality, helping companies meet customer expectations and reduce rejected products. However, payback time is also shaped by maintenance requirements, spare-part availability, operator training, production volume, and changing market conditions. A machine may deliver a strong return in a high-volume operation but require more time to recover its cost in a smaller facility. Careful evaluation of performance data, total ownership costs, operational risks, and future production needs allows businesses to choose equipment with sustainable profitability rather than focusing only on the initial price.

 Econe Machinery