How to Improve Packaging Line Efficiency in 2026?

Time:2026-11-08 Author:Amelia
0%

A packaging line can appear busy while losing minutes at every changeover, sensor stop, and rejected seal. In 2026, those small losses matter. The Deloitte and MAPI 2024 Smart Manufacturing and Operations Survey found that 92% of surveyed executives expect smart manufacturing to drive competitiveness. Yet technology alone will not fix a poorly understood process. Teams need reliable downtime records, clear defect codes, and operators who can flag recurring jams before they become shift-long delays.

Toyota production engineer Taiichi Ohno described the efficiency goal this way: “All we are doing is looking at the time line, from the moment the customer gives us an order to the point when we collect the cash.” That perspective fits packaging: track product flow from infeed to pallet, not just the filler’s rated speed. The Manufacturing Institute and Deloitte’s 2024 study projected 3.8 million manufacturing jobs would be needed by 2033, with 1.9 million potentially unfilled. Labor pressure makes ergonomic layouts, quick-change tooling, and practical automation more important. Small losses matter.

This guide explains how to improve packaging line efficiency through measurable steps: establish a baseline, identify the biggest constraint, reduce changeover time, and verify gains with consistent metrics. A caution belongs here. OEE can expose hidden losses, but rushed data entry can make its numbers look better than reality. Start with the line operators’ observations, then test one change at a time. The results may be less dramatic than a new machine promise, but they are easier to trust.
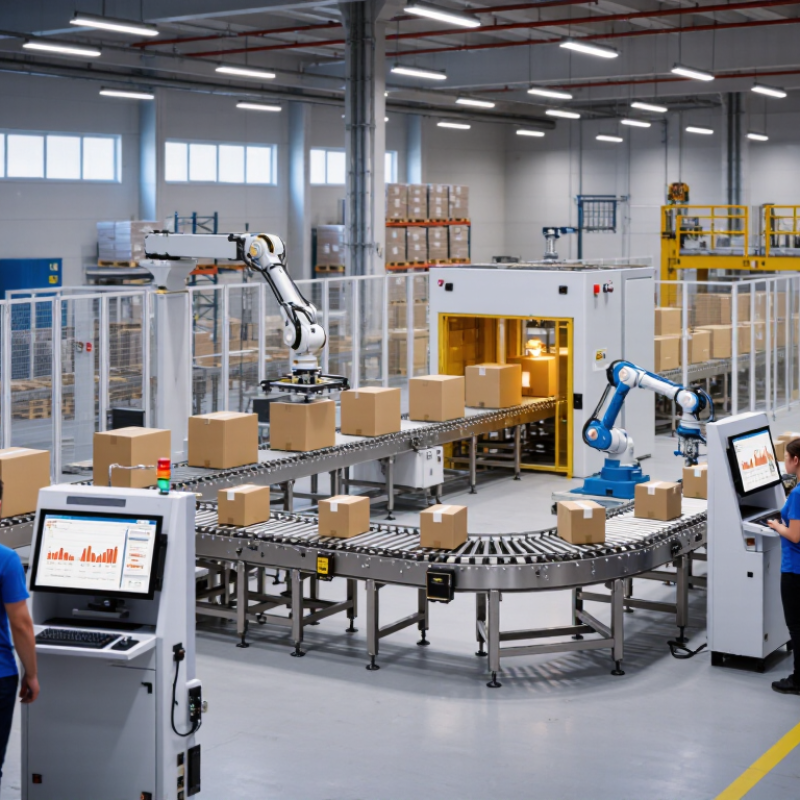
How to Improve Packaging Line Efficiency in 2026?

Assess Current Packaging Line Performance and Set Efficiency Targets

Assess packaging line performance across several normal shifts, not just during a clean, uninterrupted run. Record good units per minute, changeover time, unplanned stops, rejects, and labor hours. Note the product, package format, crew size, and shift conditions beside each reading. A line producing 90 cases per minute on one format may behave very differently on another. Small details matter.

Use timestamps from machine logs, but verify them on the floor. A brief film jam may be recorded as a long stop if operators restart the timer late. Watch where work accumulates: near the filler, labeler, or case packer. Ask operators what causes repeated pauses. Their notes may reveal a loose guide rail or awkward refill task that the dashboard misses. We have all trusted a tidy chart too quickly.

Set targets from the verified baseline, then make them specific and achievable. If average good output is 72 cases per minute, a first target might be 76, provided quality and safety remain steady. Track the target by shift and format, rather than blending unlike runs. Review results weekly. If speed rises but rejects double, the target needs revision. Leave room for uncertainty; the baseline itself may need another week of measurement.

Identify Bottlenecks, Downtime, and Sources of Production Waste

A packaging line rarely loses capacity in one dramatic failure. The constraint may be a case erector that runs slightly slower, a label sensor that needs repeated adjustment, or an operator waiting for cartons. Record actual output at each station during normal shifts, not only during a planned trial. Compare cycle times with the line’s target rate. Small gaps matter.

Look beyond major breakdowns. Log stoppages by cause and duration, including brief jams that operators clear without calling maintenance. Check the time stamps against shift notes; vague entries such as “machine issue” rarely reveal a fix. A simple downtime board can help. Keep categories practical, though. Too many labels make accurate logging harder.

Production waste also leaves clues. Track rejected packs, damaged cartons, excess film, and product waiting between machines. Watch a changeover from the final good pack of one run to the first acceptable pack of the next. That interval often contains searching, cleaning, and avoidable adjustments. Test one change at a time, then compare results across similar shifts. Data can mislead when product mixes differ, and I would not treat one unusually fast run as proof. Operators’ observations matter, even when the numbers look tidy.

Select Automation and Digital Tools to Address Priority Constraints

Packaging-line efficiency rarely improves simply because a plant buys more automation. It improves when teams identify what repeatedly interrupts flow: a slow carton erector, label corrections, or operators waiting for materials. Track downtime, changeover time, and output by shift for two weeks. Keep the measures simple. Compare planned and actual production, then check the numbers on the line. A dashboard cannot explain everything.

Choose tools to match the constraint. If micro-stops cluster around case packing, a counter and event log can help distinguish jams from poor infeed spacing or inconsistent cases. For repetitive lifting or placement, test a collaborative robot only after checking cycle time, guarding, reach, and product variation. Digital work instructions may reduce setup errors, but only if they reflect how operators actually work. Paper forms can still capture exceptions better.

Pilot one change on one shift, using a clear baseline and a named owner. Track good units per labor hour, rejects, downtime, and changeover duration. Review the figures with operators and maintenance staff. Don’t automate a workaround. Early data may be messy, and it is worth admitting that. Some lines need better material staging before software or machinery can help. Invest in tools that address a measured constraint, then reassess what is slowing the line next.

How to Improve Packaging Line Efficiency in 2026? - Select Automation and Digital Tools to Address Priority Constraints

Illustrative planning scenario for one packaging line—not an industry benchmark. Replace example values with measured production data before setting targets.

Priority constraint Example baseline Planning target Automation or digital action How to verify
Unplanned stops Availability: 85% of planned production time 90% availability Capture stop events automatically; use a live downtime dashboard and reason codes to identify recurring faults. Compare weekly availability and minutes lost by stop reason.
Slow running Performance: 90% of the validated ideal rate 94% of the validated ideal rate Trend actual versus ideal cycle rate by machine; investigate the station that limits line throughput before increasing speed. Review good units per minute and rate loss by station, product, and shift.
Rejects and rework Quality: 98% good units out of total units produced 95.5% good units or better Add in-line checks where appropriate, such as fill-level, code, label, or seal inspection; record defects by type. Track first-pass good units, defect rate, and rework by defect category.
Long product changeovers 45 minutes from last good unit to first good unit of the next run 35 minutes, subject to product and safety requirements Use a digital changeover checklist, pre-stage verified materials, and standardize parameter recipes with controlled access. Time each changeover consistently and compare by product transition.
Material starvation or blockage 30 minutes of recorded production loss per shift 15 minutes or less per shift Use line-side inventory signals or replenishment alerts; monitor accumulation and low-material sensors at key transfer points. Separate starvation and blockage events from machine faults in downtime records.
Maintenance response and repeat faults Mean time to repair (MTTR): 40 minutes for recorded breakdowns 30 minutes, without compromising safe repair procedures Connect machine alerts to a maintenance work-order workflow; keep fault history, spare-parts status, and standard procedures accessible. Review MTTR, repeat-fault frequency, and planned versus unplanned maintenance time.
Overall equipment effectiveness (OEE) 75.0% (85% availability × 90% performance × 98% quality) About 80.7% if the three planning targets are achieved together Calculate OEE from aligned production, downtime, and quality records; prioritize the loss category with the greatest verified impact. Use consistent definitions for planned production time, ideal cycle time, and good units.

OEE = Availability × Performance × Quality. Set targets from a stable, measured baseline, validate changes on the line, and review safety, product quality, and throughput together.

Standardize Workflows, Maintenance, and Operator Training

Packaging line efficiency in 2026 depends less on pushing speed than on removing avoidable variation. A clear workflow should show who stages cartons, checks labels, clears jams, and records rejects. Keep current instructions at the station, not buried in a binder. Use photos to show correct seal placement and a sample to clarify acceptable print quality. Small cues matter. During changeovers, record settings that worked, while allowing operators to flag exceptions instead of blindly following an unsuitable setup.

Maintenance belongs in the daily routine. Operators can inspect guards, sensors, belts, and air lines at shift start, then report unusual noise or repeated stops. Technicians can use these notes to plan service before a minor misalignment causes a long stoppage. A checklist cannot replace diagnosis. Too many checks may get rushed. Test it. Track which inspection steps actually catch emerging problems, and adjust the routine when they do not.

Training should cover real tasks, not just a sign-off sheet. Ask each operator to demonstrate a safe restart, a film roll change, and the correct response to a misfeed. Pair newer staff with experienced operators, then revisit skills after equipment or materials change. Some teams train well but neglect refresher practice; that gap is easy to miss. Review downtime records and operator observations together. When a procedure repeatedly needs workarounds, revise it with the crew and test the new method across different shifts.

How to Improve Packaging Line Efficiency in 2026

Standardize workflows, strengthen preventive maintenance, and train operators to improve overall equipment effectiveness (OEE).

Illustrative 12-week example using realistic OEE values, not universal benchmarks. Track the same measures on your own line to evaluate improvement.

Track Key Performance Indicators and Refine Line Operations

In 2026, packaging-line efficiency starts with finding where minutes disappear. Track overall equipment effectiveness (OEE), throughput, changeover time, and unplanned stops by shift and product. Small losses matter. A five-minute jam at a labeler may recur unnoticed, while a daily average hides the pattern. Record stop reasons at the machine, not hours later from memory.

A 2019 Deloitte–MAPI study surveyed 600 manufacturing executives and associated smart-factory initiatives with 10–12% higher labor productivity and 10–20% greater output. These are reported study estimates, not guaranteed gains for every packaging line. Use them as context, then compare your own baseline before changing speeds or staffing. Measure the boring details: good units per minute, scrap, micro-stops, and time to restart after a fault. Review trends weekly with operators; their notes often explain what a dashboard cannot. A dashboard can still flatter the line if teams classify short stops inconsistently. We should admit that. Test one adjustment at a time, such as changing film tension or replenishment timing, and keep the result visible for several shifts.

FAQS

How should a plant establish a reliable packaging-line baseline?

Measure several normal shifts. Record good cases per minute, changeover time, unplanned stops, rejects, and labor hours. Note the package format, crew size, and shift conditions. Verify machine timestamps on the floor; a late restart can distort stop duration.

Why track results by shift and package format?

A line making 90 cases per minute on one format may run differently on another. Keep results separate instead of blending unlike runs. Not quite comparable.

How can teams set realistic efficiency targets?

Start with verified output. If the average is 72 cases per minute, a first target might be 76, provided quality and safety remain steady. Review results weekly. If rejects double, revise the target.

What helps reveal recurring bottlenecks?

Measure output at each station during regular shifts. Watch for work piling up near the filler, labeler, or case packer. Log small jams, too. They add up.

Which details should downtime records include?

Record each stop’s cause and duration, including brief pauses operators clear themselves. Replace vague notes like “machine issue” with specific observations. Keep categories simple, or accurate logging may become harder.

How can teams spot avoidable production waste?

Track rejected packs, damaged cartons, excess film, and product waiting between machines. Observe a changeover from the last good pack to the first acceptable one. Searching and adjustments can consume more time than expected.

When should a plant consider automation or digital tools?

Match the tool to a measured constraint. A counter and event log may clarify case-packing jams. For repetitive lifting, test cycle time, guarding, reach, and product variation before trying a collaborative robot.

How should a new tool or process change be tested?

Pilot one change on one shift with a clear baseline and named owner. Track good units per labor hour, rejects, downtime, and changeover time. Review results with operators and maintenance staff. Early data may be messy; we may still miss something.

Conclusion

Improving packaging line efficiency in 2026 starts with understanding how the line performs today. Review production rates, changeover times, downtime, and quality results, then set clear, realistic targets. Examine each stage of the process to find bottlenecks, recurring stops, and sources of waste, such as unnecessary handling or inconsistent procedures. Prioritize improvements according to their likely impact rather than making changes without a clear purpose.

The next step in how to improve packaging line efficiency is to match practical solutions to the constraints identified. Automation and digital tools may help where they address specific needs, while standardized workflows, preventive maintenance, and consistent operator training can improve reliability across the line. Track relevant indicators regularly, including output, downtime, and defects. Use the results to refine processes, confirm whether changes are working, and identify the next opportunities for improvement.

Amelia

Amelia

Amelia is a seasoned marketing professional with a wealth of expertise in our company’s core offerings. With an unwavering passion for driving growth and innovation, she plays a pivotal role in shaping our marketing strategies and enhancing brand visibility. A key aspect of her responsibilities......